What Is Technical Analysis and How It Works
A clear, chart-driven introduction to technical analysis, explaining how price structure, trends, and liquidity define market behavior — and how traders use them to build actionable scenarios.
 Lucas Grant
Technical analysis is the study of market behavior through price charts. Instead of focusing on earnings, macro data, or sentiment surveys, it concentrates on what the market is actually doing — printing candles, forming trends, and creating liquidity imbalances. For traders, it’s the cleanest way to read crowd behavior and anticipate future moves.
What Technical Analysis Really Measures
At its core, technical analysis is about structure. Markets move through phases — accumulation, expansion, distribution, and retracement. Price leaves clues about which phase it’s in:
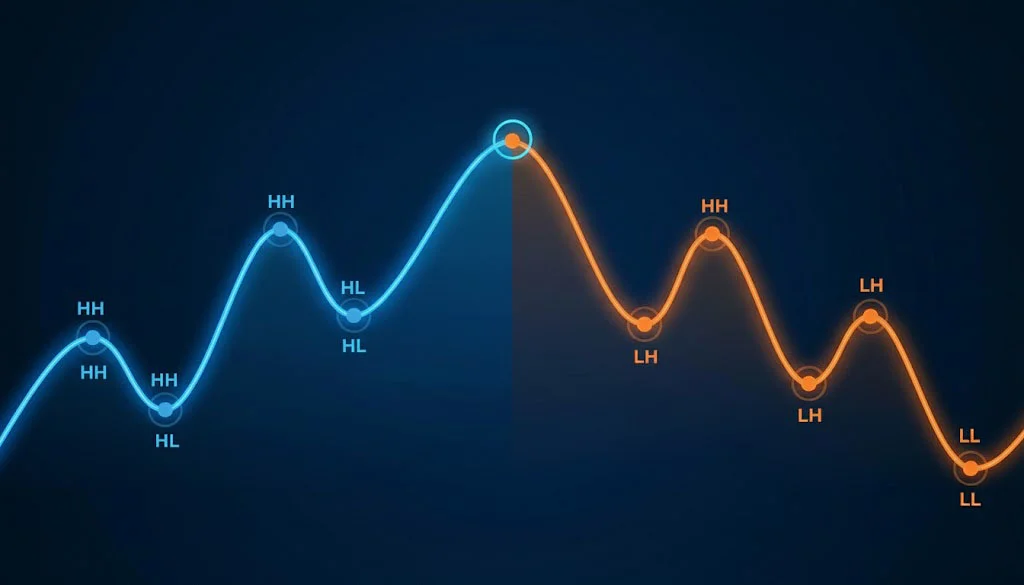
- Trend direction: higher highs / higher lows or the opposite.
- Momentum shifts: divergences between price and indicators.
- Liquidity zones: areas where orders accumulate.
- Key levels: the points where the market historically reacts.
When you look at a chart through this lens, it stops being “random noise” — and becomes a structured map of where participants enter, exit, and defend their positions.
How Technical Analysis Works in Practice
The workflow is systematic. Regardless of the asset, timeframe, or volatility regime, the logic is almost always the same:
1. Identify Higher-Timeframe Structure
HTF structure defines the primary direction. A trader begins by evaluating whether the market is trending, ranging, or transitioning. HTF structure remains intact unless a major swing level is broken.
2. Map Key Liquidity Zones
Price gravitates toward liquidity: previous highs/lows, inefficiencies, imbalance fills, and untapped levels. These zones often serve as magnets before reversals or expansions occur.
3. Define Scenarios
Technical traders don’t predict; they prepare scenarios. Typically two:
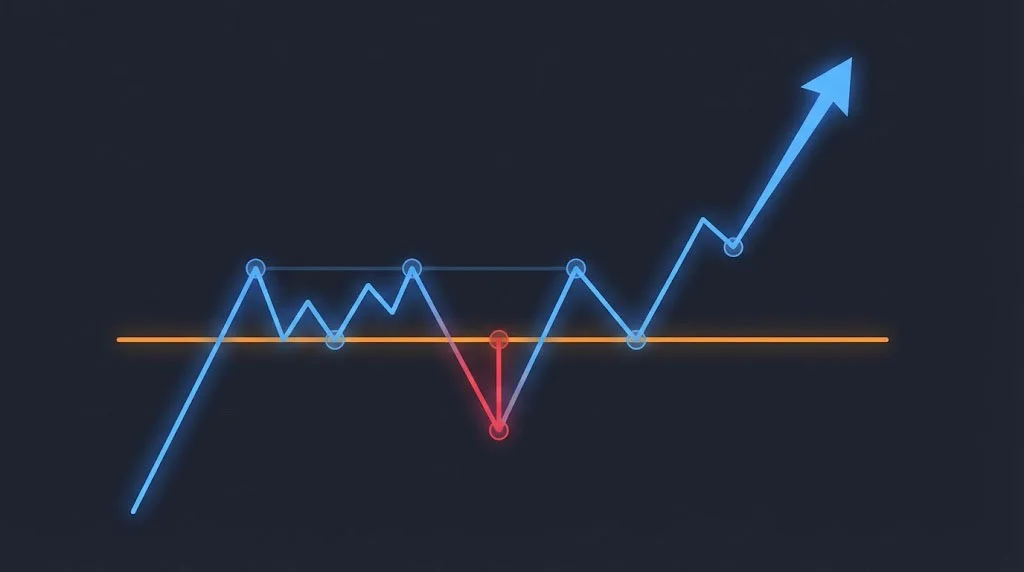
- Bullish scenario: reclaim of a key resistance → range expansion upward.
- Bearish scenario: failure test or sweep of liquidity → move back into the range.
Price tells you which one activates — not opinion.
4. Execute Using Triggers
Trade entry isn’t based on a “feeling” but on a trigger: breakout retest, sweep-and-reclaim, momentum shift, or pattern confirmation. The trigger validates the scenario and filters noise.
Why Technical Analysis Works
Markets move because of order flow. Price charts are simply the visible footprint of that flow. Technical analysis works because:
- Liquidity pools consistently attract price.
- Participants react predictably to levels they can see.
- Momentum shifts reflect real changes in buyer/seller engagement.
- Structures repeat across markets and timeframes.
Whether you trade stocks, crypto, FX, commodities, or indices — the underlying behavioral mechanics are the same. That’s why patterns, levels, and structures remain reliable across asset classes.
Common Misconceptions
“TA predicts the future.”
It doesn’t. TA defines probabilities and scenarios. The edge lies in reading structure early and adjusting fast when invalidation occurs.
“Indicators are the core of TA.”
Indicators are optional. Price action and structure come first; indicators simply visualize momentum or smoothing. A chart should stay readable without clutter.
“Markets are random.”
Short-term movements may appear chaotic, but liquidity, structure, and participant behavior are distinctly non-random. Order flow logic creates recurring patterns — and TA maps those patterns.
The Foundation for the Entire Series
This article sets the groundwork for the full technical analysis series. Next lessons will break down:
- Market structure in detail (HH/HL → LH/LL transitions)
- Liquidity concepts: sweeps, imbalances, liquidity traps
- Trend analysis & momentum
- Support/resistance & key levels
- Breakouts vs. fakeouts
- Chart patterns & their real mechanics
- Multi-timeframe confluence
- Risk management for TA-based strategies
Each topic will include diagrams, structure maps, and step-by-step chart logic — the same tools I use for HTF analysis and trade preparation.
Technical analysis isn’t magic and never will be. But when applied with structure, discipline, and scenario planning, it becomes one of the most consistent frameworks for understanding market behavior. This series is built to give you that framework — from fundamentals to advanced concepts.
-
 How Money Really Works From Earning to InvestingBasics
 -
How to Safely Store Crypto Assets: SEC Releases New Investor BulletinBasics
-
The Ultimate Personal Finance Reading Plan for 2026Basics
-
What Are Tokenized Stocks and How They WorkBasics
-
If You Can’t Answer These Money Questions by 30, You’re Flying BlindBasics
-
Retirement Savings Goals by Age — And What to Do If You’re BehindBasics