S&P 500 Holds Near Key Levels as Markets Weigh Middle East Risks and U.S. Data
U.S. stock futures rise as investors assess Middle East developments, upcoming housing data, and key technical levels for the S&P 500 and Nasdaq.
 Daniel Brooks
U.S. equity markets remain in a zone of elevated volatility as investors continue to assess geopolitical risks in the Middle East alongside incoming macroeconomic data. While recent statements from former U.S. President Donald Trump suggesting a possible de-escalation have helped stabilize sentiment, uncertainty around the trajectory of the conflict continues to drive market turbulence.
Trump confirmed that the United States is not currently considering a ground operation, though he warned of a strong response should shipping in the Strait of Hormuz come under threat. Markets interpreted the comments as a potential signal that escalation risks may be contained — at least for now.
Still, geopolitical uncertainty remains a key driver of short-term volatility across global markets.
Key Economic Data in Focus
Investors are closely watching several U.S. economic indicators scheduled for release today.
- NFIB Small Business Optimism Index (February)
Consensus: 99.6
Previous: 99.3 - Existing Home Sales (February)
Consensus: −0.8% month-over-month
Previous: −8.4%
A stronger reading in small business sentiment could reinforce the narrative that U.S. domestic demand and business activity remain resilient. Meanwhile, a less severe decline in existing home sales compared with January may indicate that the housing market is beginning to stabilize.
For now, the balance of risks remains neutral, though volatility is elevated as traders adjust to geopolitical headlines and macro signals.
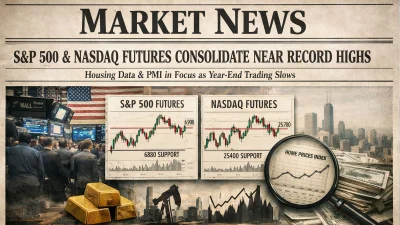
Technical Picture: S&P 500 and Nasdaq Levels
From a technical standpoint, major U.S. indices remain within a short-term consolidation structure.
- S&P 500 resistance: 6800
- S&P 500 key support: 6700
- Next resistance: 6900
The S&P 500 finished the previous session higher after rebounding from an early gap down, approaching the 6800 resistance level while maintaining a local sideways range.
The Nasdaq Composite similarly advanced during the session, testing the 25,000 level and the upper boundary of its short-term ascending channel.
For bullish momentum to continue, indices need to remain above 6800 on the S&P 500 and 25,000 on the Nasdaq. A break higher could open the path toward 6900 on the S&P 500 and 25,500 on the Nasdaq.
What Is Driving Markets Right Now
Global equities have shown signs of recovery following comments suggesting that a potential military operation against Iran may be approaching its conclusion. The shift in tone helped calm energy markets after the recent spike in oil prices.
Crude prices are now showing early signs of stabilization as investors reassess the likelihood of prolonged supply disruptions and the potential recovery of energy flows.
In addition to geopolitical developments, markets are also focused on corporate earnings expectations. Analysts currently forecast that S&P 500 companies will deliver EPS growth of about 11.5% year-over-year in the first quarter of 2026.
Later today, the U.S. Treasury will also conduct an auction of 3-year Treasury notes, another event that could influence short-term liquidity conditions in financial markets.
Sector Performance
Sector performance during the previous session showed a mixed picture across cyclical industries.
- Top performers: Industrials (XLI), Materials (XLB)
- Lagging sectors: Financials (XLF), Energy (XLE)
Growth sectors broadly moved higher:
- Leaders: Semiconductors (SOXX), Biotechnology (IBB), Technology (XLK)
- Weakest performer: Cannabis ETF (MJ)
Defensive sectors also gained alongside the broader market, with Health Care (XLV) leading and continuing to trade within a medium-term upward channel.
Cross-Market Signals
Several intermarket indicators provide additional context for current market conditions.
- Oil: After a sharp rally within an upward channel, prices have pulled back slightly but remain above the key $85 level.
- U.S. Treasury yields: Yields are easing modestly while testing the local uptrend and the 4.1% support level.
- VIX volatility index: The VIX remains within a medium-term ascending channel, currently testing support near 23.
- Gold: Gold prices continue to consolidate near the 5200 level, reflecting cautious investor positioning.
For now, markets appear to be entering a phase of heightened but controlled volatility, where geopolitical headlines, macro data releases and technical levels will likely dictate short-term direction.
-
 S&P 500 Futures Slide as Middle East Escalation Fuels VolatilityStocks
 -
S&P 500 and Nasdaq Futures Consolidate Near Record Highs as Volatility Stays SubduedStocks
-
US Stock Futures Consolidate as Investors Await Jobless ClaimsStocks
-
S&P 500 and Nasdaq Futures Trade Sideways as PMI and Labor Data Take Center StageStocks
-
S&P 500 Futures Stabilize Above 6900 as Year-End Volumes ThinStocks
-
Wall Street Futures Pause Near Highs Ahead of US Housing and PMI DataStocks