How to Decode Candlestick Signals Correctly
Learn how to read candlestick charts with clear, practical methods used by professional traders. This guide explains candle structure, momentum signals, rejection wicks, and high-probability patterns to help you understand market psychology and improve your technical analysis.
 Lucas Grant
Candlesticks tell a story — but only if you know where to look. For technical traders, they are the first language of market psychology: where buyers stepped in, where sellers rejected levels, and where momentum is quietly shifting beneath the surface.
In this guide, we’ll walk through how to read candlesticks the way professional desks do — focusing on context, volume, and clean signals. Textbook where needed. Brutally honest when the market demands it.
1. The Anatomy of a Candle
Every candlestick reflects a short battle: open, high, low, close (OHLC). But the structure reveals who controlled the session.
- Body: The distance between open and close — shows conviction.
- Wicks: The extremes — show rejection.
- Color: Bullish close (above open) or bearish close (below open).
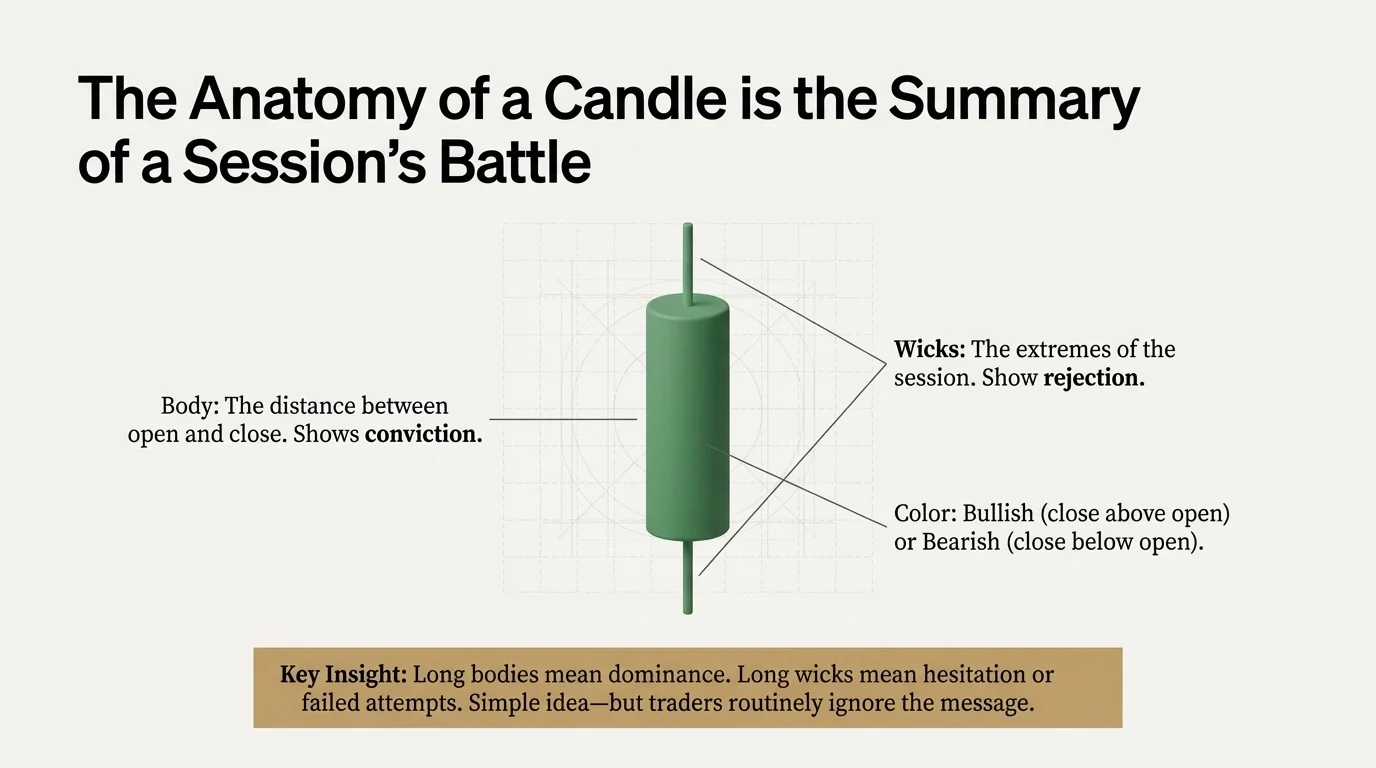
Key insight: Long bodies mean dominance. Long wicks mean hesitation or failed attempts. Simple idea — but traders routinely ignore the message.
2. Momentum Candles: When the Market Speaks Clearly
Momentum candles show strong directional intent. On a chart, they stand out — wide body, minimal wick, decisive close.
- Bullish momentum candle: buyers controlled the session from start to finish. Clean break. Volume confirmed.
- Bearish momentum candle: sellers pressed through bids; buyers couldn’t push price back. Clear rejection on the first test.
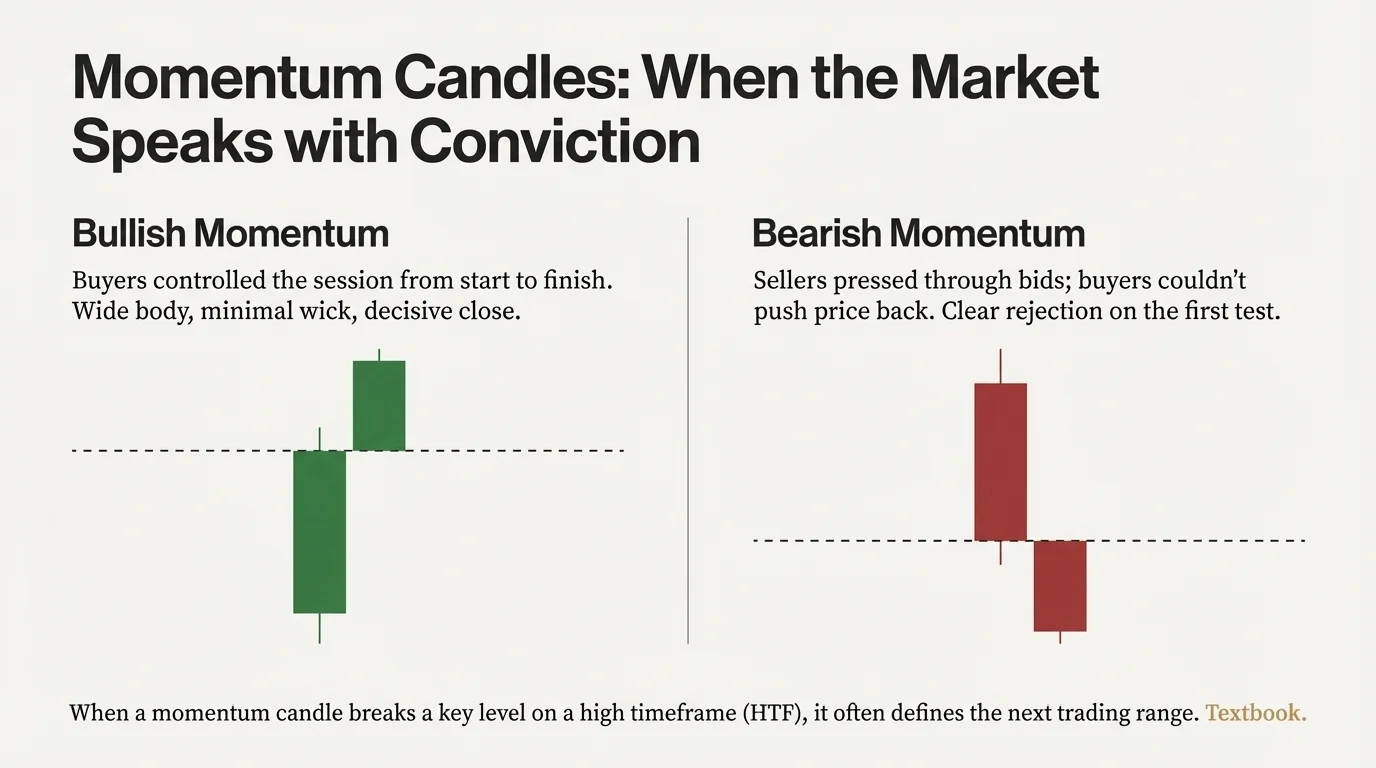
When a momentum candle breaks a key level on a high timeframe (HTF), it often defines the next trading range.
3. Rejection Candles: Where Moves Fail
Rejection candles matter because they highlight intent — and failure. Someone tried to push price; someone else pushed back harder.
- Long upper wick: aggressive sellers hit into strength; buyers couldn’t hold the high.
- Long lower wick: aggressive buyers stepped in; sellers couldn’t break the floor.
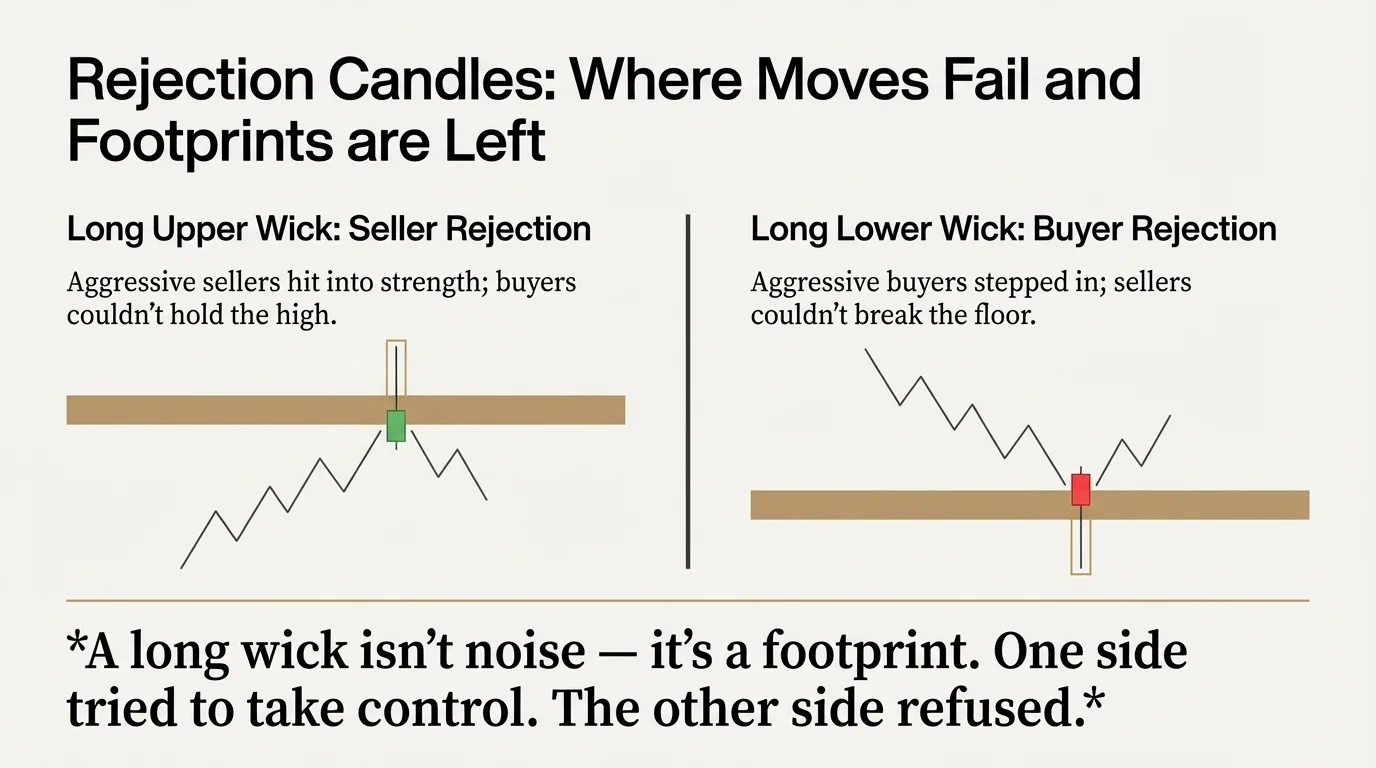
A long wick isn’t noise — it’s a footprint. One side tried to take control. The other side refused.
4. The Most Important Candle Patterns
You don’t need fifty patterns. You need a few that actually matter in live markets, combined with context.
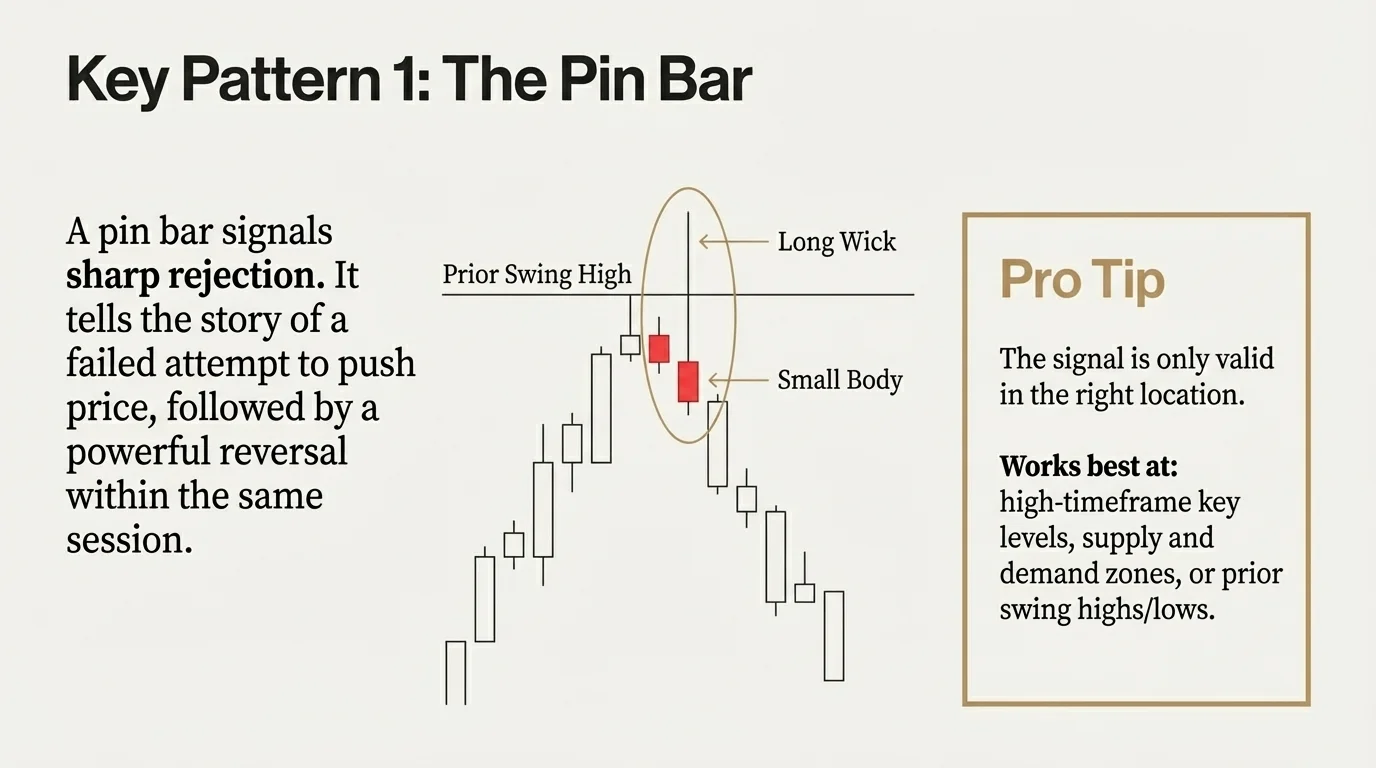
4.1. Pin Bar
The pin bar is a single candle with a long wick and a small body. It signals sharp rejection and a potential reversal, if the context supports it.
Works best: high-timeframe key levels, supply and demand zones, prior swing highs or lows.
4.2. Engulfing Candle
An engulfing pattern happens when a candle’s body fully engulfs the body of the previous candle. It’s a visual shift in control.
- Bullish engulfing: buyers reclaim control after a failed selloff.
- Bearish engulfing: sellers smother weak buying pressure.
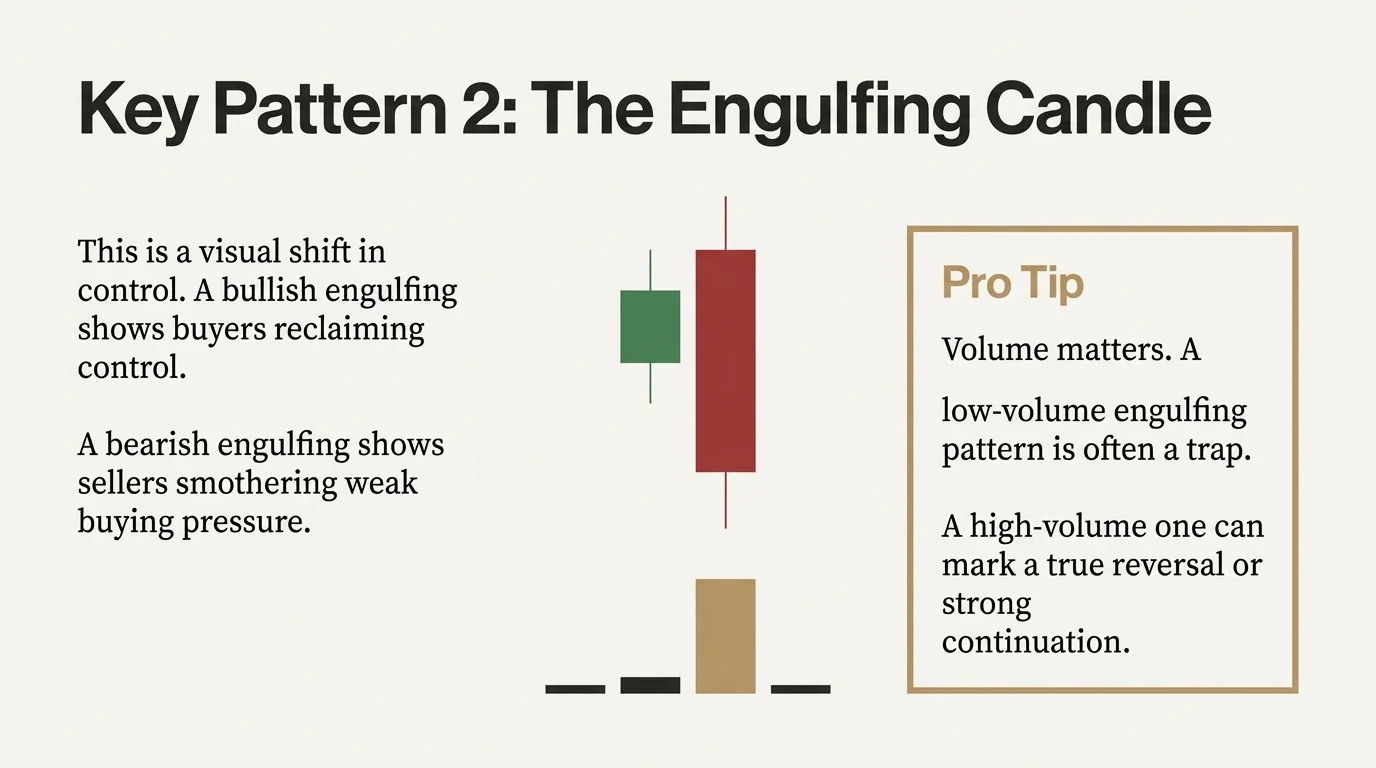
Volume matters. A low-volume engulfing pattern is often a trap. A high-volume one can mark true reversal or strong continuation.
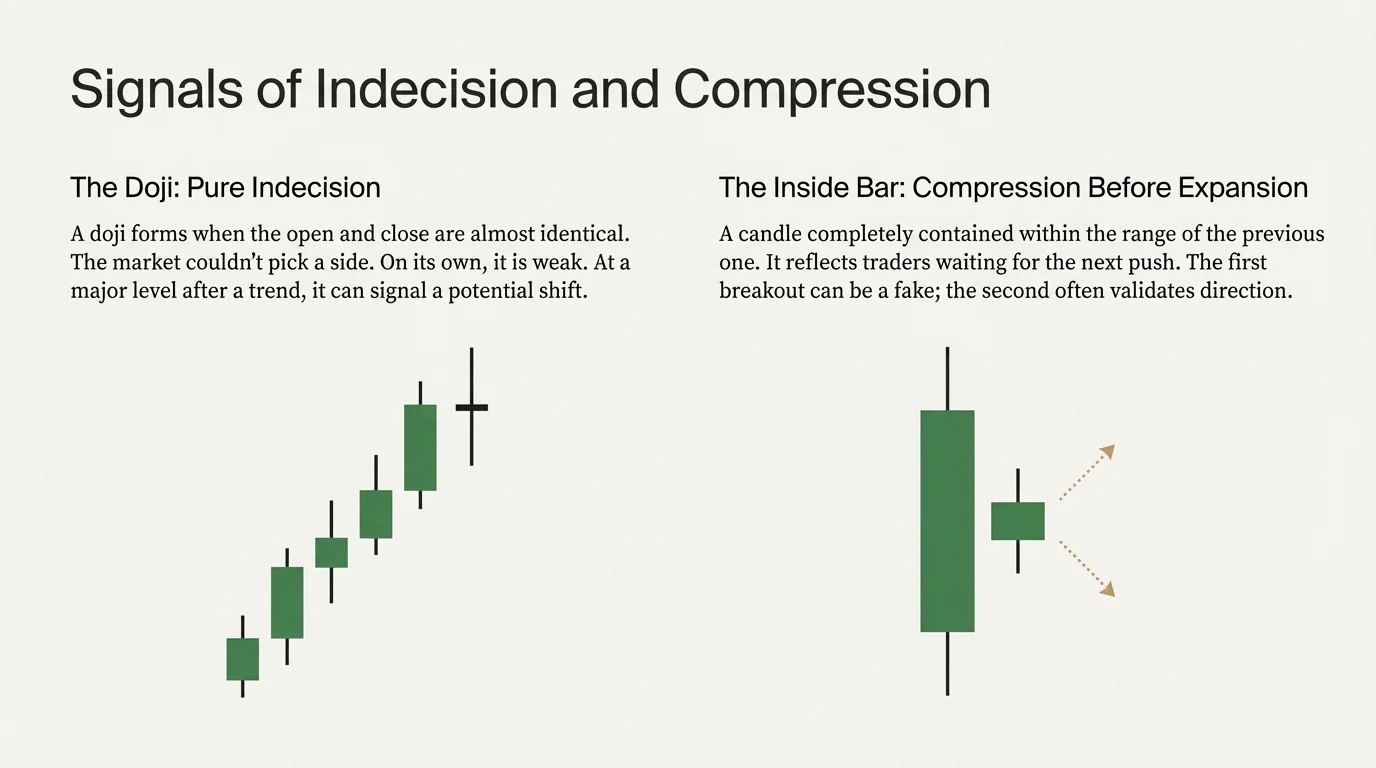
4.3. Doji
A doji forms when the open and close are almost identical. The market couldn’t pick a side. Traders on the desk simply call it what it is: indecision.
On its own, a doji is weak. At a major level after a trend move, it can signal a potential shift — especially if the next candle confirms it.
4.4. Inside Bar
An inside bar is a candle completely contained within the range of the previous candle. It reflects compression — traders waiting for the next push.
Once price breaks out of an inside bar, we often see expansion. The first move can be a fake. The second move often validates direction.
5. Context Matters More Than the Candle
Reading a single candlestick in isolation is a beginner mistake. Professionals evaluate the environment first, then the candle.
- Trend direction: high-timeframe (HTF) structure outranks low-timeframe (LTF) noise.
- Liquidity zones: equal highs/lows, clusters of wicks, prior breakout levels.
- Volume behaviour: does volume confirm or contradict the candle’s message?
- Market session: New York open looks very different from Asia chop.
Example: a bullish engulfing candle in a strong downtrend is often just a relief bounce. Not a full reversal. Stay objective.
6. How to Combine Candles With Levels
A candle’s meaning changes when it interacts with a level that the market respects — prior highs, lows, weekly opens, or well-tested ranges.
- Break and hold: a strong body closes above or below the level — continuation is likely.
- Break and fail (fakeout): price wicks beyond the level but closes back inside — trap, not breakout.
- Retest confirmation: aggressive buyers or sellers show up on the retest — clean continuation setup.
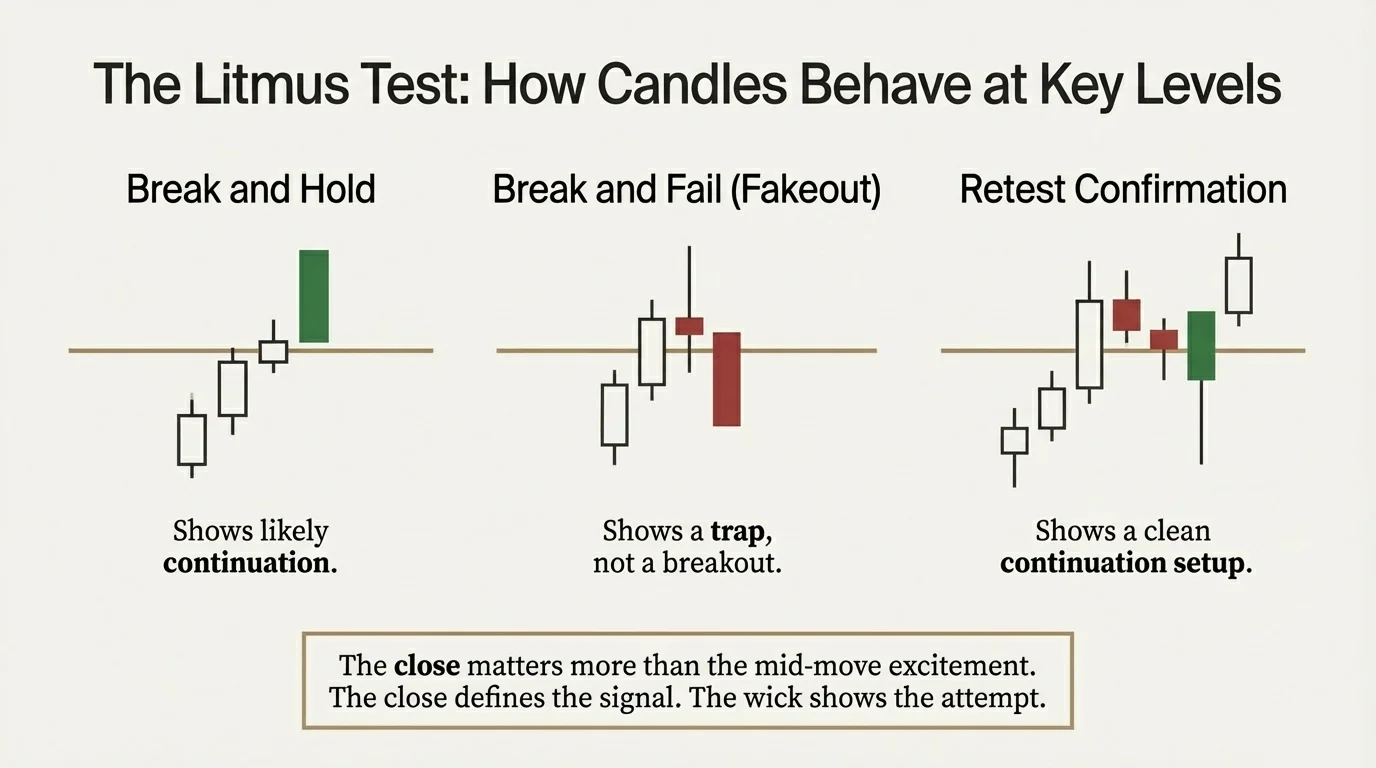
The close matters more than the mid-move excitement. The close defines the signal. The wick shows the attempt.
7. Multi-Timeframe Reading: HTF First, Always
High-timeframe candles anchor your bias. Low-timeframe candles help with execution and entries.
- HTF (daily, weekly): structure, major demand/supply, big momentum shifts.
- LTF (hourly, 15-minute): patterns, entry triggers, stop placement detail.
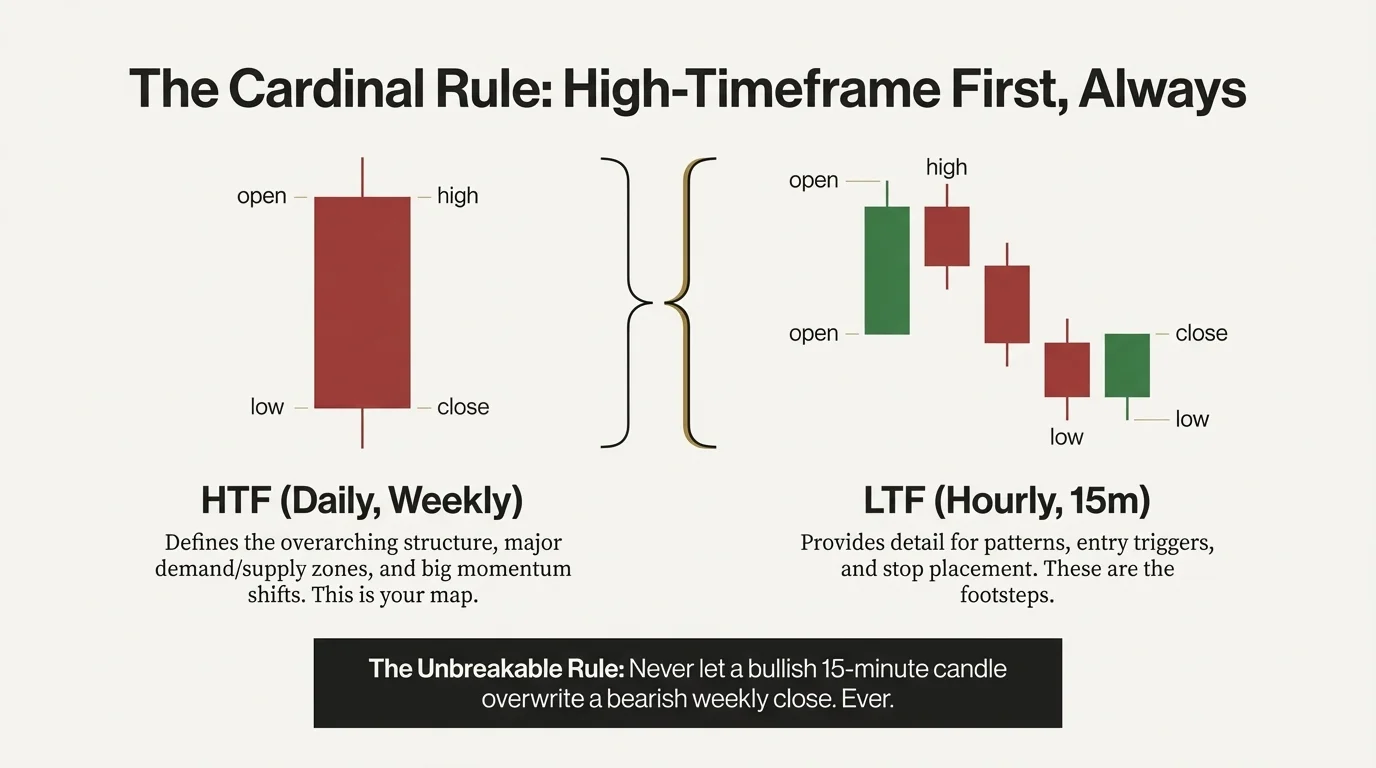
Never let a bullish 15-minute candle overwrite a bearish weekly close. Ever.
8. A Simple Three-Step Method You Can Use Daily
- Identify the environment. Define trend, ranges, key levels, and obvious liquidity pockets.
- Read the candle story. Who controlled the session? Was it a clean break or hesitation?
- Map your scenarios. Continuation, reversal, or trap — and where your risk sits in each case.
Final Thoughts
The best traders don’t react to every candle. They interpret. They wait for confirmation. They let structure guide them and use candlesticks to validate the plan.
One candle rarely decides everything. But one perfectly placed candle, at a clean level, with volume on its side? That can define the next move.