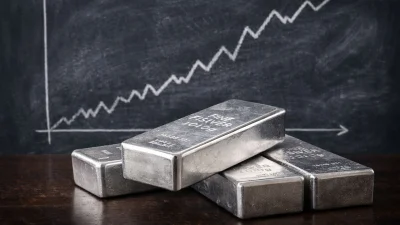
A Massive Technical Breakout Suggests Silver’s Run Might Just Be Beginning
Silver prices have doubled this year, breaking above $60 per ounce as supply deficits, possible U.S. tariffs and expectations of faster Fed rate cuts fuel one of the strongest rallies in decades.
 Daniel Brooks
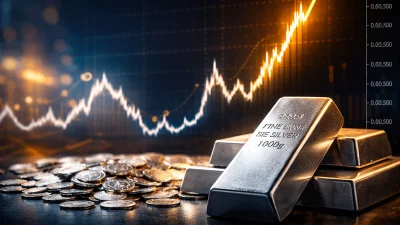
Silver extended its sharp rally on Wednesday, holding near $62 per ounce after trading close to $50 in late November — a dramatic rise from an average of about $30 at the start of the year. The metal has now roughly doubled in 2024, outpacing even gold’s exceptional 60% gain.
Once again, investors are recalibrating expectations around U.S. monetary policy. The latest surge followed reports that the White House is interviewing final candidates to replace Federal Reserve Chair Jerome Powell. Markets increasingly expect the next Fed leadership to pursue faster rate cuts, particularly if — as reported — Kevin Hassett, former Director of the National Economic Council, emerges as the frontrunner.
Under Powell, the Fed delivered two measured 25 bps cuts this year — in September and October. A more aggressive easing path would further depress yields on interest-bearing assets, improving the relative appeal of precious metals, which offer no coupons or dividends.
Supply Constraints and Tariff Anxiety Add Fuel to the Rally
The macro shift comes atop a tightening physical market. Traders remain alert to the possibility that the U.S. could introduce tariffs on imported silver after the metal was added in November to the government’s 2025 Critical Minerals List. This designation raises the likelihood of a Section 232 national security review — the same mechanism previously used to impose tariffs on steel and aluminium.
No investigation has been launched, but the mere prospect has caused buyers to stockpile metal pre-emptively, disrupting flows and lifting prices. Industrial demand for silver accounts for more than half of global consumption, driven by electric vehicles, solar panels and electronics. Even incremental supply fears tend to magnify price volatility.
Market Structure Tightens as Producers Build Inventories
Producers across clean-energy and automotive sectors have accelerated purchases in recent weeks, seeking to secure inventory before any policy shift. This demand coincides with an already persistent supply deficit in the global silver market, deepening the mismatch between physical availability and forward demand.
The result: a mechanically stronger market supported by both macro and micro fundamentals.
Technical Picture: A Rare Multi-Decade Cup-and-Handle Breakout
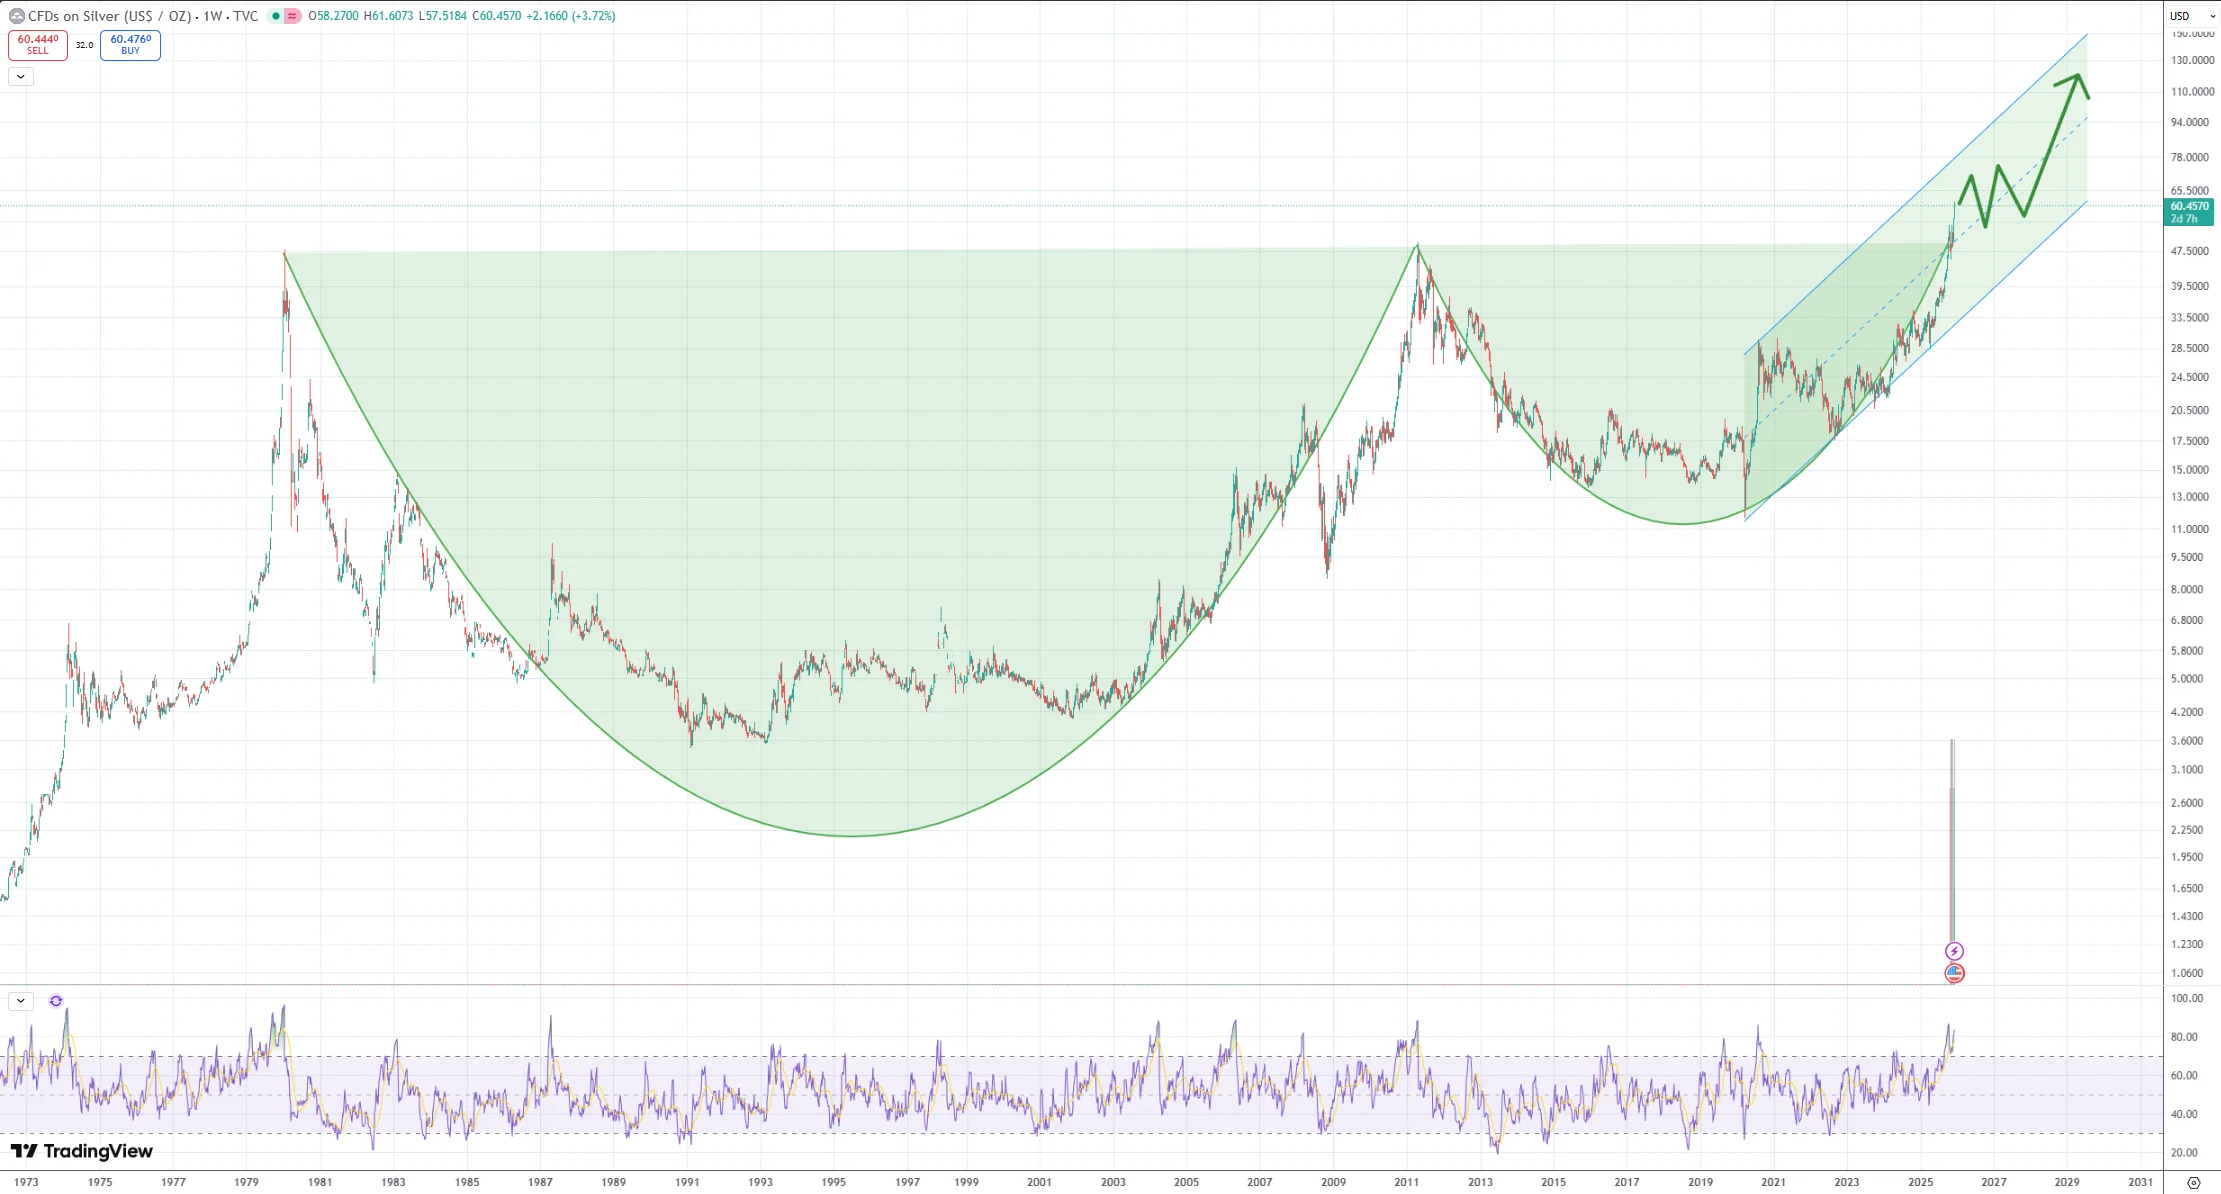
Lucas Grant, Senior Technical Analyst at Finmire, notes that silver has completed a high-timeframe cup-and-handle pattern that has been forming for decades.
On the weekly chart, silver broke through the $47.5 resistance level — the “handle” of the structure — confirming a textbook bullish breakout. Volume expanded on the move, indicating aggressive buyers stepping in after multiple rejections over the years.
“Clean break. Volume confirmed. This is a structurally significant move,” Lucas notes. He highlights that silver is now trading in a rising channel with potential upside toward $80–$95 in the medium term, assuming the breakout holds and macro conditions remain supportive.
The setup is unusual in its scale: multi-decade consolidations that resolve upward often precede long-duration trend expansions.
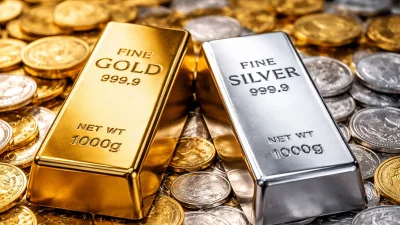
The Gold–Silver Ratio: Why History Still Favors Silver
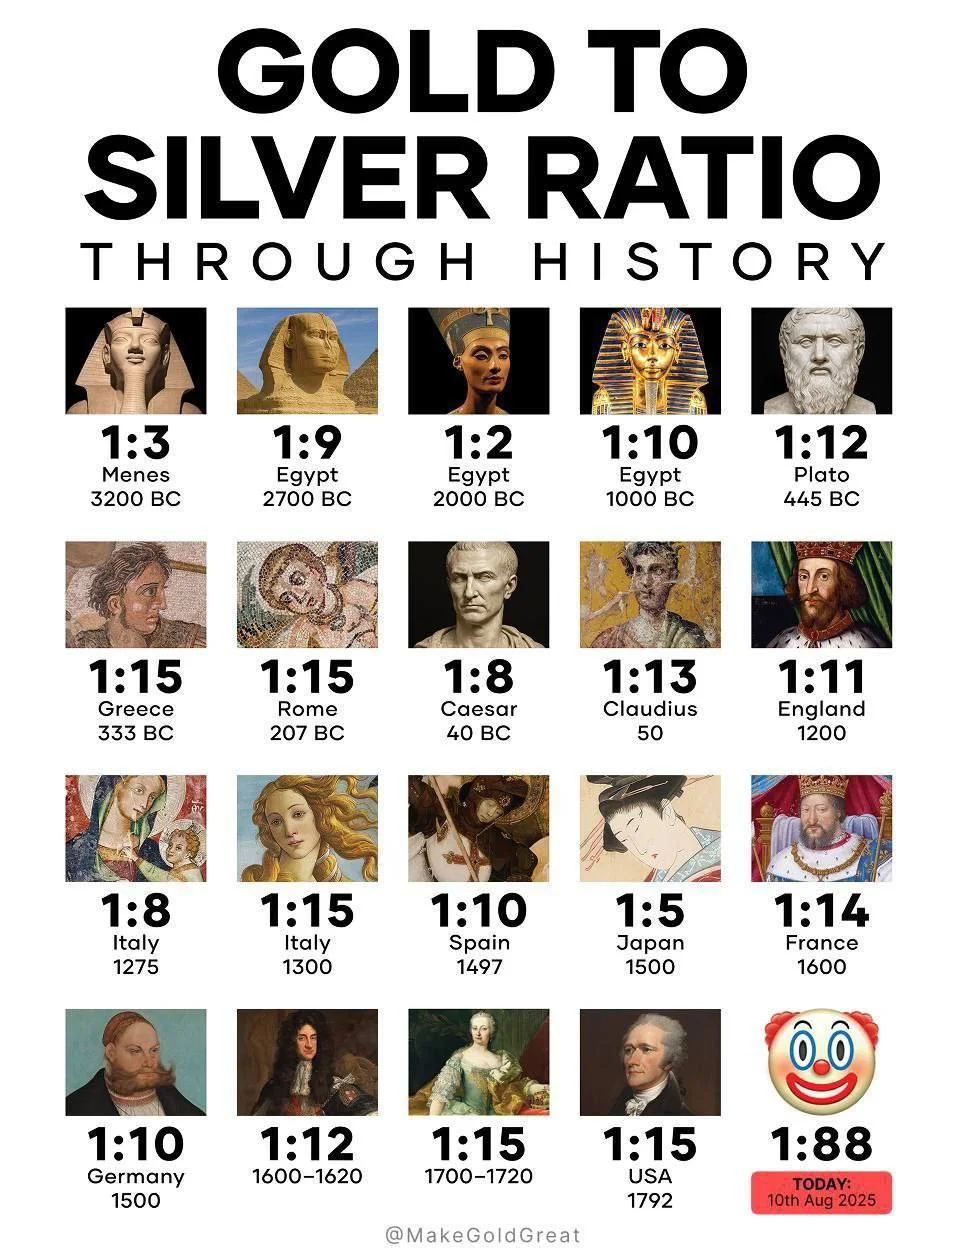
Another way to frame the current move is through the gold–silver ratio — the number of ounces of silver needed to buy one ounce of gold. For long stretches of history, that ratio gravitated around 10–15:1, with many major economies implicitly or explicitly using similar parities in their monetary systems.
By contrast, today’s market still trades near a ratio of around 88:1. Even after this year’s rally, it takes roughly eighty-eight ounces of silver to purchase a single ounce of gold. That is far above the historical norms shown on the chart, where periods from ancient Egypt to early modern Europe frequently clustered closer to 1:12 or 1:15.
For some investors, this extreme divergence is a key part of the bull case. If the ratio were to move even part of the way back toward its long-run range — whether because silver rises, gold falls, or some combination of both — silver could deliver outsized relative returns. The recent breakout in price action is therefore seen not as the end of the move, but potentially the beginning of a longer re-rating of silver versus gold.
What Comes Next?
Traders now await clarity from the Fed’s meeting later today and signals around future policy. If the incoming Chair adopts a more dovish stance — as markets currently price — the tailwinds for precious metals could intensify.
At the same time, any move by Washington to open a Section 232 investigation into silver imports would likely add another layer of volatility. The intersection of policy, supply pressure and technical strength creates a landscape where silver could remain one of the most dynamic commodities into 2025.
-
 SLV in Focus as Silver Enters a New Structural PhaseCommodities
 -
Why Copper Is Outperforming Gold — And What It Means for Metals MarketsCommodities
-
Central Banks Step Up Strategic Gold Accumulation Amid Macro UncertaintyCommodities
-
Why Silver Could Significantly Outperform the S&P 500 in the Years AheadCommodities
-
Silver Prices Hit a Historic High Above 85 an Ounce on Geopolitical FearsCommodities
-
Are Commodities Setting Up for a New Supercycle in 2026?Commodities