Why Copper Is Outperforming Gold — And What It Means for Metals Markets
Copper prices hit record highs above $11,400 per ton as supply disruptions and energy-transition demand tighten the market. Here’s why copper stands out — and how investors can gain exposure.
 Olivia Carter
Copper prices are keeping pace with gold — and in some respects, outperforming it. On December 3, copper closed in London at $11,480.15 per metric ton, marking the highest level since systematic price records began in the 1960s. The move broke the previous peak set in October 2025 at $11,159.05.
The rally has been sharp and persistent:
- Year-to-date (2025): +30.4%
- Last 12 months: +26%
- Last month: +5.9%
- Last 7 trading days: +4.7%
Why Copper Prices Are Surging
1. Major Supply Disruptions
In September, a fatal landslide forced the closure of the Grasberg Block Cave operation in Indonesia — the world’s second-largest copper mine. The affected block accounted for roughly 70% of projected output and remains offline with no clear timeline for reopening.
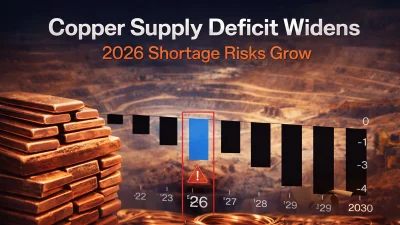
2. A Growing Supply Deficit
According to J.P. Morgan, the global refined copper market could face a deficit of around 330,000 metric tons in 2026. After near-zero mine supply growth in 2025, expectations for 2026 have been cut to just +1.4% — roughly 500,000 tons below projections made earlier this year.
3. Structural Demand From the Energy Transition
Demand tied to electrification is accelerating. Copper consumption in energy-transition sectors is growing at an average annual rate of 10.7%, driven by:
- Electric vehicles: +14.3%
- Solar power: +5.6%
- Wind energy: +9.3%
Grid upgrades, AI-driven data centre construction, and rising defence spending are adding further pressure to demand.
Is This a Broad Metals Trend?
The short answer: partially — but copper is an outlier.
Metals performance remains uneven:
Metals Showing Strength
- Copper: record highs (+30.4% in 2025)
- Aluminium: ~4% growth expected in 2025
- Tin: forecast to rise ~4% in 2025
- Gold and silver: trading near historical peaks
Metals Under Pressure
- Nickel: down 21% in 2024, stagnating near $15,000/ton
- Iron ore: -9% in 2024 amid weak industrial demand
- Zinc: -6% in 2024, oversupply expected in 2026–2027
The World Bank’s metals price index still points to a 10% decline in 2025 and a further 3% drop in 2026. Copper, however, continues to defy the broader trend.
Why Copper Is Different
Copper stands alone among base metals where structural supply shortages coincide with rapidly accelerating demand. Other metals face either excess capacity or weak end-market consumption.
This unique positioning is what keeps copper resilient — even as broader commodity markets struggle.
What to Watch in 2026: The China Factor
China accounts for roughly 58% of global copper demand. In previous cycles, copper rallies often faltered when Chinese domestic demand weakened.
This time, conditions look different. China’s refined copper production is slowing, raising the risk of raw material shortages for local smelters — a dynamic that could further tighten the global market.
Can Investors Still Profit?
Yes — despite the rally. Copper has already gained over 30%, but the underlying fundamentals remain supportive:
- Supply deficits are widening
- Industrial demand continues to accelerate
- Several forecasts point toward $12,500 per ton over the medium term
With limited new supply coming online, prices may remain supported as energy-transition demand expands.
Ways to Gain Exposure
- Copper ETFs: a straightforward approach without physical storage (e.g., COPX for miners, CPER for futures exposure)
- Mining stocks: copper producers often outperform during upcycles — including Freeport-McMoRan, Southern Copper, BHP, and Rio Tinto
- Copper futures: suitable only for experienced investors due to leverage and volatility
Key Risks
- Global recession reducing industrial demand
- Sharper-than-expected slowdown in China
- A stronger U.S. dollar weighing on commodity prices
Strategy Note
Rather than attempting to time market peaks, a phased entry approach may help manage volatility.
Splitting allocations into three or four tranches over several months can help smooth entry prices. A 1–3 year horizon aligns with expectations that the peak supply deficit will emerge in 2026–2027.
-
 SLV in Focus as Silver Enters a New Structural PhaseCommodities
 -
A Massive Technical Breakout Suggests Silver’s Run Might Just Be BeginningCommodities
-
Copper Supply Shock Deepens as 2026 Deficit Risks GrowCommodities
-
Central Banks Step Up Strategic Gold Accumulation Amid Macro UncertaintyCommodities
-
Oil Reaches Parity With Silver for First Time Since 1980Commodities
-
Why Copper Prices Are Surging to Record LevelsCommodities