Will There Be a Santa Claus Rally in 2025?
Historical data favors a Santa Claus Rally, but record highs, Fed uncertainty, and thin holiday liquidity raise questions about whether seasonality will hold this year.
 Daniel Brooks
As markets enter the so-called Santa Claus Rally window, investors are once again weighing seasonal optimism against an unusually fragile macro backdrop.
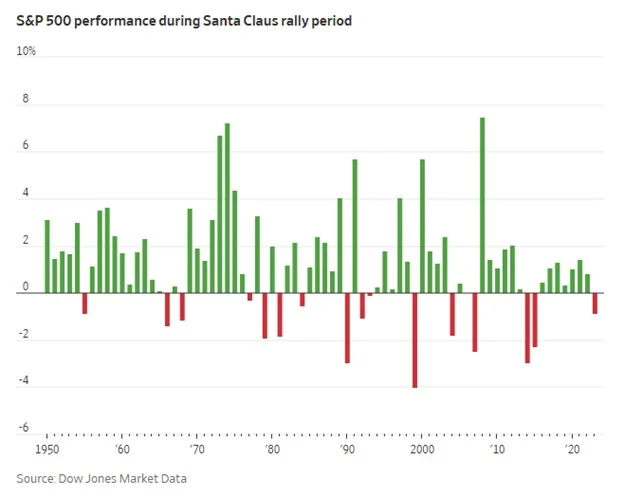
According to data highlighted by The Kobeissi Letter, the S&P 500 has posted gains in 79% of Santa Claus Rally periods since 1929, with an average return of approximately +1.6%. The rally traditionally spans the last five trading days of December and the first two trading days of January.
Using post-1950 data, the pattern remains consistent: the index has advanced in 79% of cases, with an average gain closer to +1.3%. Over the past eight years, the S&P 500 declined during this window only once.
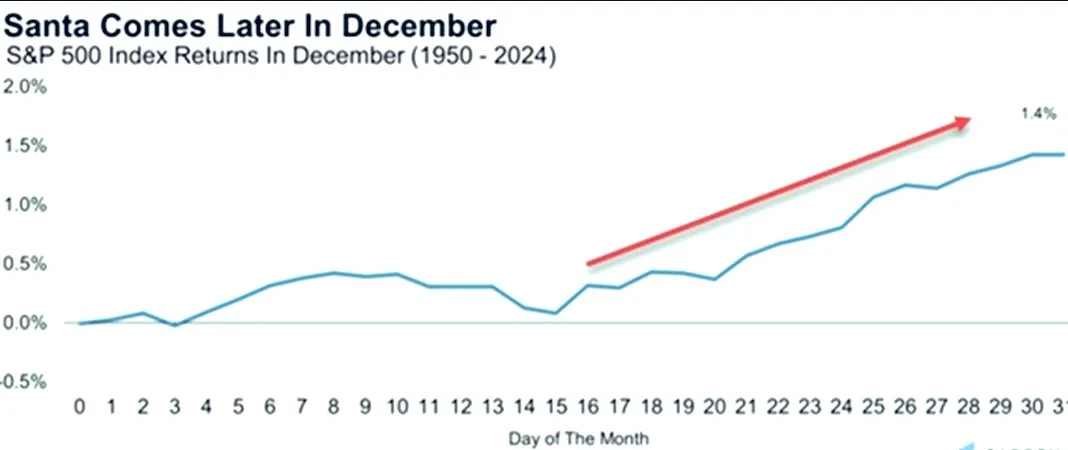
Late-December Strength Has Been Persistent
Seasonality studies also show that the final two weeks of December have historically been the strongest period for U.S. equities over the past 75 years. Returns tend to accelerate late in the month, as illustrated by historical S&P 500 performance data showing gains clustering toward year-end.
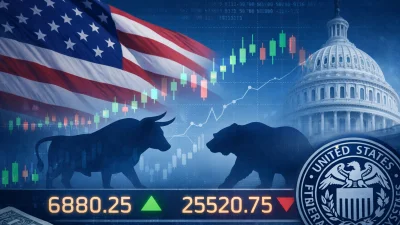
Some analysts have gone further, suggesting that continued momentum could push the S&P 500 toward the 7,000 level by year-end if seasonal trends persist.
Why This Year Is Different
Despite the compelling statistics, market participants caution against relying too heavily on seasonality alone.
“Strong historical odds: a 79% chance of a Santa Rally, averaging around +1.5%. It’s a real seasonal pattern. But this isn’t a normal year.”
U.S. equities are entering the Santa window near all-time highs, while the Federal Reserve remains in a tense holding pattern. Policy expectations are finely balanced, valuations are stretched, and liquidity typically thins dramatically during the final trading sessions of the year.
Thin holiday liquidity can amplify moves in both directions, increasing sensitivity to any unexpected macro or policy headlines.
Seasonality Is a Tendency — Not a Law
Another key risk is that markets are already well aware of the Santa Claus Rally statistics.
“A Santa Claus rally is statistically common, but never guaranteed. This year, the market already knows those stats.”
If the S&P 500 does push toward 7,000, analysts note it is unlikely to be driven by calendar effects alone. Instead, it would likely reflect a combination of liquidity dynamics, Fed expectations, and year-end FOMO positioning converging at the same time.
The Key Question for Investors
The central issue facing markets is whether seasonal tailwinds can overpower macro vulnerabilities during one of the most illiquid weeks of the year.
Historically, Santa has delivered more often than not. But with valuations elevated and policy uncertainty lingering, investors are watching closely to see whether this year’s rally brings gifts — or whether the market leaves room for a late-December Grinch.
-
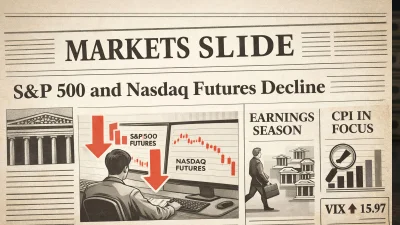
 S&P 500 and Nasdaq Futures Consolidate Near Record Highs as Volatility Stays SubduedStocks
 -
S&P 500 Futures Stabilize Above 6900 as Year-End Volumes ThinStocks
-
US Stock Futures Consolidate as Investors Await Jobless ClaimsStocks
-
U.S. Index Futures Pull Back Near Record Highs as Markets Await CPIStocks
-
S&P 500 and Nasdaq Futures Trade Sideways as PMI and Labor Data Take Center StageStocks
-
U.S. Index Futures Edge Lower Ahead of Key Fed SignalsStocks